
Users dashboard
TheUsersdashboard is the launching point into user behavior analysis and threat prevention.
这个指示板提供了六世sibility into user-behavior patterns across an organization. Using this data, you can proactively monitor, detect, and flag behavior that fall outside the norm, such as phishing or ransomware attacks.
The Users dashboard contains the following sections:
Discovered users. Total number of users in your organization using the data sources for which you have enabled Analytics.
Risky users. Users that have acted in a risky manner or presented risky behavior. List of risky users who have the highest risk score and risk indicator occurrences associated with their account.
High risk users. Users that represent an immediate threat to the organization.
Medium risk users. Users who might have multiple serious violations on their account and must be monitored closely.
Low risk users. Users who have some violations detected on their account, but potentially not a threat.
Non-risky users. Users who do not have any active violations detected on their account. These users are not considered a threat for the selected period.
Users in watchlist. Users monitored closely by administrators.
Privileged users. Users who can view sensitive data and modify critical system settings in an organization.
Risk Indicators. Displays the top five risk indicators in your organization.
Access Summary. Summarizes the total number of attempts that users have made to access the resources within your organization.
Policies and Actions. Displays the top five policies and actions applied on user profiles.
Risk Categories. Displays the risk categories that Citrix Analytics supports. Risk indicators with similar behavioral patterns are grouped into the categories.
Discovered users
Total number of users in your organization using the data sources for which you have enabled Analytics. They might or might not have a risk score associated with their account. It is possible that the number of discovered users on theUsersdashboard is more than the number of risky users.
Click theDiscovered Userslink on the dashboard to view theUserspage that displays a complete list of users discovered by Citrix Analytics. TheUserspage also displays the data sources, the risk scores, and the number of risk indicator occurrences associated with the discovered users.

Note
On theUsersdashboard and theUserspage, the number of discovered users are displayed for the last 13 months irrespective of the selected time period. When you select a time period, the risk indicator occurrences change based on the time selection.

View the following information:
Facets
Filter the user events based on the following categories:
Risk Score: User events based on high risk, medium risk, low risk, and zero risk scores.
User: User events based on admin privilege, executive privilege, and watchlist users.
Discovered Data Sources: User events based on the data source that you have onboarded.
Workspace App Status: Supportability status of Citrix Workspace app versions used on the user device.
Note
The Workspace app status is determined from the user events received from the Citrix Director. To view the status, you mustconnect your Citrix Analytics to Citrix Director. Otherwise, the status of all the Citrix Virtual Apps and Desktops users is shown asInactive.
Use the following labels to identify the status:
Supported: The Citrix Workspace app version is supported by Citrix Analytics and the user events are received from the app.
Partially supported: The Citrix Workspace app version is supported but no user events are received from the app. To identify and troubleshoot the issues, see thetroubleshooting guide.
Unsupported: The Citrix Workspace app version is not supported and no user events are received from the app. The user must update the Citrix Workspace app to a supported version. For the list of supported versions, see thesupported clients.
Not Available (NA): The user is not using the Citrix Virtual Apps and Desktops data source. They might be using a different data source such as Content Collaboration, Secure Workspace Access, and Gateway.
Inactive:用户在没有任何活动会话e Citrix Virtual Apps and Desktops in the last one week. So, no events are received from the user.
In the last one week, if the user updates the Citrix Workspace app to four different versions (for example: xx, xy, yx, and yy), then the tooltip displays the four different versions. The status changes according to the following scenario.
Scenario Workspace app status When all four versions (xx, xy, yx, and yy) are supported. Supported Among the four versions, at least one version (xx) is unsupported and the remaining versions (xy, yx, and yy) are supported. Unsupported Among the four versions, at least one version (xx) is partially supported and the remaining versions (xy, yx, and yy) are supported. Partially supported Among the four versions, the (xx) version is unsupported, the (yx) version is partially supported, and the remaining two versions (yx, yy) are supported. Unsupported Note
The Unsupported status takes precedence than the Supported status and the Partially supported status.
Search box
Use the search box to search events for the users. You can use operators in your query to narrow down the focus of your search. For information on the valid operators that you can use in your query, seeSelf-service search.
Score
The risk score determines the level of risk a user poses to an organization for a specific time period. The risk score value is dynamic and varies based on user behavior analytics. Based on the risk score, a user can fall under one of the categories: high risk user, medium risk user, low risk user, and user with zero risk score.
User
List of all users discovered by Analytics. Select a user name to view the user information and risk timeline for the user. The user might or might not have triggered any risk indicator. If there are no risky events associated with this user, you see the following message.

If there are risky events associated with a user, you see the risk indicators on their risk timeline. Select the user to view theirrisk timeline.
A user can be marked as aprivilegedand added to thewatchlist.
Risk Indicator Occurrence
The number of times a risk indicator is triggered for a user. A risk indicator can bedefaultorcustom. When you select the time period, the risk indicator occurrences change based on the time selection.
Discovered data source
The data source associated to a user. When a user is actively using the data source, Analytics receives the user events from that data source. To receive user events, you must turn on data processing on the data source site card, which is available on theData Sourcespage.
Risky users
Risky users are discovered users who have risky events associated and have triggered at least one risk indicator. The level of risk a user poses to the network for a specific time period is determined by the risk score associated with the user. The risk score value is dynamic and is based on user behavior analytics. Based on the risk score, a risky user can fall into one of the three categories: high risk user, medium risk user, or low risk user.
On theRisky Userspane, you can sort the top five risky users based on the highest score or the highest risk indicator occurrences.
SelectHighest Scoreto view the top five risky users based on the highest risk score.
SelectRisk Indicatorto view the top five risk indicators with the maximum occurrences.

Click theRisky Userslink on top or theSee Morelink in theRisky Userspane to view theUserspage. This page displays all risky users and their risk indicators. You can use the facets and the search bar to filter the events based on your requirements.
Note
On theUsersdashboard and theUserspage, the number of risky users are displayed for the last 13 months irrespective of the selected time period. When you select a time period, the risk indicator occurrences change based on the time selection.

High risk users
Users with risk score between 90 and 100. These users represent immediate threats to the organization.
On theUsersdashboard, you can view the number of high risk users for the last 13 months. For example, the following image shows five high risk users in the last 13 months.

Click theHigh Risk Userstile to view theUserspage. The page displays the details about the high risk users such as risk score, risk indicator occurrences, and their data sources. When you select the time period, the risk indicator occurrences change based on the time selection.
Learn more:Risky Users
Medium Risk Users
Users with risk score between 70 and 89. These users might have multiple serious violations on their account and must be monitored closely.
On theUsersdashboard, you can view the number of medium risk users for the last 13 months. For example, the following image shows eight medium risk users in the last 13 months.

Click theMedium Risk Userstile to view theUserspage. The page displays the details about the medium risk users such as risk score, risk indicator occurrences, and their data sources. When you select the time period, the risk indicator occurrences change based on the time selection.
Learn more:Risky Users
Low Risk Users
Users with risk score between 1 and 69. These users might have some violations detected on their account. They can also include users who were previously high or medium risk users. These users have been reevaluated over a pre-determined time period.
On theUsersdashboard, you can view the number of low risk users for the last 13 months. For example, the following image shows 147 low risk users in the last 13 months.

Click theLow Risk Userstile to view theUserspage. The page displays the details about the low risk users such as risk score, risk indicator occurrences, and their data sources. When you select the time period, the risk indicator occurrences change based on the time selection.
Learn more:Risky Users
Non-risky users
Users with zero risk score. These users do not have any active violations detected in their account for the selected time period.

Click theNon Risky Userstile to view theUserspage. The page displays the users with zero risk score selected and their data sources. For a selected time period, these non-risky users can have risk indicator occurrences associated with them although their risk score is zero.
Users in watchlist
List of users monitored closely for potential threats. For example, you can monitor users who are not full-time employees within your organization by adding those users to the watchlist. You can also monitor users who trigger a specific risk indicator frequently. You either add a user to the watchlist manually or definepoliciesto add users to the watchlist.
If there are no users added to the watchlist, you see the following screen on theUsersdashboard.

If you have added users to the watchlist, on theUsersdashboard, you can view the top five users in the watchlist based on the highest score.

Click theUsers in Watchlisttile or theSee Morelink on theUsers in Watchlistpane to view theUserspage. The page displays the list of all users in the watchlist.
Note
On theUsersdashboard and theUserspage, the number of users in the watchlist are displayed for the last 13 months irrespective of the selected time period. When you select a time period, the risk indicator occurrences change based on the time selection.
Learn More:Watchlist
Privileged users
Privileged users are the employees who have legitimate access to sensitive data and system settings in an organization. Because of their privileged rights, the malicious actions of privileged users are often indistinguishable from their everyday activities. Therefore, the actions of privileged users remain undetected for a long time. Such actions expose organizations to a wide variety of risks. To overcome this challenge, Citrix Analytics provides the privileged user monitoring feature. This feature enables you to closely monitor the behavior anomalies of privileged users in your organization.
On theUsersdashboard, you can view the top five privileged users based on the highest risk score. The privileged users are categorized as administrators and executives.
Admins. Users who have administrator rights to a product or service. For example, when a user’s privilege is elevated to administrator in the Content Collaboration service, this information is displayed on theUserspage. You can then monitor the activities of the administrator users.
Consider the user Maria Brown who was assigned admin privileges in the Content Collaboration service. Maria starts excessively deleting files and folders, and triggers the machine learning algorithm that detected unusual behavior. TheExcessive file or folder deletionrisk indicator is added to the user’s risk timeline. Citrix Analytics helps you to compare this risk indicator with the information available on theUserspage. You can decide whether the risk indicator was triggered after the user was assigned admin privileges in Content Collaboration. If yes, you can take appropriate actions on the privileged user’s profile.
Executives. Users, preferably from the top management in your organization. On theUserspage, you can add or remove users as executive users. For instructions, see theAdd as privileged userandRemove as privileged usersections.
Consider a scenario where you have added a user as a privileged user. The user starts deleting files and folders excessively, and triggers the machine learning algorithm that detected unusual behavior. TheExcessive file or folder deletionrisk indicator is added to the user’s risk timeline. Citrix Analytics helps you to compare the risk indicator with the information on theUserspage. When you compare the information, you can determine if the risk indicator was triggered after the user was marked as an executive user. If yes, you can take appropriate actions on the user’s profile.

Click thePrivileged Userslink on top or theSee Morelink in thePrivileged Userspane to view theUserspage that displays privileged users withAdminsandExecutivesalong with the latest risk indicator details. Privileged users are represented with an icon in theUSERcolumn.
Note
On theUsersdashboard and theUserspage, the number of privileged users are displayed for the last 13 months irrespective of the selected time period. When you select a time period, the risk indicator occurrences change based on the time selection.
Add as privileged user
On theUserspage, navigate to theAll Userstable and select the users that you want to add as executive users.
ClickMark Privileged.

Remove as privileged user
On theUserspage, navigate to theAll Userstable and select the users that you want to remove as executive users.
ClickRemove from Privileged.

Risk Indicators
Summarizes the top five risk indicators for a selected time period. The risk indicators can bedefaultorcustom. For default risk indicators, Citrix Analytics collects data from the discovered data sources and on which the data processing is enabled.
For custom risk indicators, Citrix Analytics collects data from the following data sources based on the risky events generated:
- Citrix Content Collaboration
- Citrix Gateway
- Citrix Secure Workspace Access
- Citrix Virtual Apps and Desktops
On theRisk Indicatorspane, you can view the top five risk indicators and sort them based on total occurrences or severity.

ClickSee Moreon theRisk Indicatorspane to view theRisk Indicator Overviewpage.
TheRisk Indicator Overviewpage provides insights into the default and the custom risk indicators. Select the time period to view the risk indicators and their occurrences.

Click a risk indicator on theNAMEcolumn to view details about the risk indicator such as timeline view, users, occurrences, and triggered time. Alternatively, you can click a risk indicator on theRisk Indicators仪表板以查看其详细信息。如下图shows the details for Excessive access to sensitive files (DLP alert).

Access Summary
This dashboard summarizes all the Gateway access events for a selected time period. It shows the number of total access, successful access, and failed access through Citrix Gateway.
Click the pointers on the graph to view theSelf-service search for Gatewaypage. For successful sign-in scenarios, Gateway access events are sorted by the status code on the page.

Policies and Actions
Displays the top five policies and actions applied on user profiles for a selected time period. Click theSee Morelink on thePolicies and Actionspane to get detailed information about the policies and actions.

Top Policies
The top five configured policies are determined based on the number of occurrences. When you are in theTop Policiessection of the dashboard and selectSee More, you are redirected to theAll Policiespage.

All policies
This page provides detailed information about all the configured policies. When you select any policy, you are redirected to theSelf-service search for Policiespage. On the left pane, you can filter based on the actions applied.
When you select a user name, you are redirected to the risk timeline. The policy-based action is added to the user’s risk timeline. When you select the action, its details are displayed on the right pane of the risk timeline.
Top Actions
The top five actions associated with the policies that were applied on the user profiles. This section does not display the actions that you have applied manually on the user profiles. The top actions are determined by the number of occurrences.
ClickSee Moreto view all the policies-based actions on theActionspage.
Actions
The page provides the list of all policies-based actions that has been applied on your users for the selected time period. You view the following information:
Name of the action applied as per the policy
用户数量的行动已经被应用ed
Number of occurrences of the action
Number of policies associated with the action
Date and time of the applied action

Click an action to view all the associated policies. These policies are sorted based on the number of occurrences. For example, clickRequest end user responseon theActionspage. TheAll Policiespage displays all the policies associated with theRequest end user responseaction.

On theAll Policiespage, click a policy to view the user events on which the action has been applied.
Risk Categories
This dashboard provides an aggregated view of the level of risk exposure of an organization for a selected time period. Risk indicators are grouped into known categories based on the risks that are similar. Risk categorization is supported on default and custom risk indicators.

The purpose of theRisk Categoriesdashboard is to enable Citrix Virtual Apps and Desktops administrators to manage user risks and have simplified discussions with their security counterparts without the need to have an expert-level security knowledge. It allows security enforcement to take effect at an organizational level and is not limited to security administrators alone.
Use case
Consider that you are a Citrix Virtual Apps and Desktops administrator and you manage the application access rights of employees in your organization. If you go to theRisk Categories>Compromised users>Excessive authentication failures - Citrix Gatewayrisk indicator section, you can assess whether the employees to whom you had granted access have been compromised. If you navigate further, you can get more accurate insights into this risk indicator such as the failure reasons, sign-in locations, timeline details, and user summary. If you notice any discrepancies between the users that were granted access and users that were compromised, you can notify the security administrator about it. This timely notification to the security administrator contributes towards enforcement of security at an organizational level.

How to analyze the Risk Categories dashboard?
When you selectSee Moreon theRisk Categoriesdashboard, you are redirected to the page that summarizes details about the risk categories. This page contains the following details:
Risk category report: Represents the total risk indicator occurrences of each category for a selected time period.

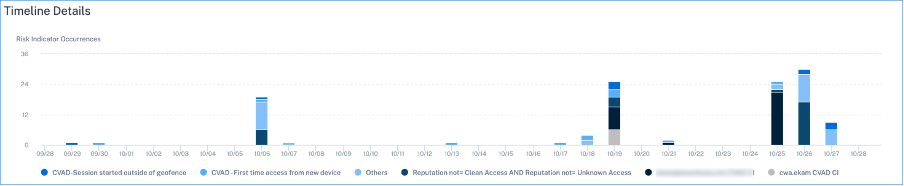
Timeline details: Provides a graphical representation of the total risk indicator occurrences of every risk category for a selected time period. If you navigate to the bottom of this section, you can sort based on risk categories for more accurate insights about the risk indicators.

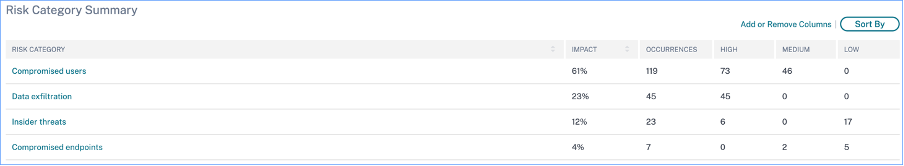
Risk category summary: This section provides details such as the impact, occurrences, and severity of the risk indicators associated with each category. Select any risk category to view details about the risk indicators associated with that category. For example, when you select theCompromised userscategory, you are redirected to theCompromised userspage.


TheCompromised userspage displays the following details:
Risk Indicator Report: Displays the risk indicators that belong to the Compromised users category for a selected time period. It also displays the total occurrences of the risk indicators that were triggered during the selected time period.

Timeline Details: Provides a graphical representation of the risk indicator occurrences for a selected time period.
Risk Indicator Summary: Displays a summary of the risk indicators generated under the compromised users category. This section also displays the severity, data source, risk indicator type, occurrences, and the last occurrence.


When you select a risk indicator, you are redirected to the page that summarizes details of that indicator. For example, if you select theFirst time access from new devicerisk indicator, you are redirected to the page that summarizes details about this indicator. The summary includes timeline details about the occurrences of this event and a user summary that lists the users that triggered this risk indicator, risk indicator occurrences, and the time of event. When you select a user, you are redirected to the user’s risk timeline.

Note
Citrix Analytics groups default risk indicators under the appropriate risk category. For custom risk indicators, you must select a risk category on theCreate Indicatorpage. For more information, seeCustom risk indicators.
Types of risk categories
Data exfiltration
这一类群体引发的风险指标malware or by employees that perform unauthorized data transfers or data thefts to or from a device in an organization. You can get insights into all the data exfiltration activities that have taken place during a specified time period, and mitigate the risks associated with this category by proactively applying actions on user profiles.
The Data exfiltration risk category groups the following risk indicators together:
| Data Sources | User Risk Indicators |
|---|---|
| Citrix Content Collaboration | Excessive access to sensitive files |
| Citrix Content Collaboration | Excessive file downloads |
| Citrix Content Collaboration | Excessive file sharing |
| Citrix Virtual Apps and Desktops | Potential data exfiltration |
Insider threats
这一类群体引发的风险指标employees within an organization. Since employees have higher levels of access to company-specific applications, organizations are at higher chances of security risks. Risky activities might be intentionally caused by a malicious insider or might be a result of a human error. In either of the scenarios, the security impact on the organization is damaging. This category provides insights into all the insider threat activities that have taken place during a specified time period. With the help of these insights, you can mitigate the risks associated with this category by proactively applying actions on user profiles.
内部威胁的风险类别组following risk indicators together:
| Data Sources | User Risk Indicators |
|---|---|
| Citrix Content Collaboration | Excessive file or folder deletion |
| Citrix Content Collaboration | Excessive file uploads |
| Citrix Content Collaboration | Malware files detected |
| Citrix Secure Workspace Access | Attempt to access blacklisted URL |
| Citrix Secure Workspace Access | Excessive data download |
| Citrix Secure Workspace Access | Risky website access |
| Citrix Secure Workspace Access | Unusual upload volume |
Compromised users
This category groups risk indicators in which users display unusual behavioral patterns such as suspicious sign-ins, sign-in failures. Alternatively, the unusual patterns might be a result of the user accounts being compromised. You can get insights into all the compromised user events that have taken place during a specified time period, and mitigate risks associated with this category by proactively applying actions on user profiles.
The Compromised users risk category groups the following risk indicators together:
| Data Sources | User Risk Indicators |
|---|---|
| Citrix Content Collaboration | Access from an unusual location |
| Citrix Content Collaboration | Ransomware activity suspected |
| Citrix Content Collaboration | Unusual authentication failures |
| Citrix Gateway | Access from an unusual location |
| Citrix Gateway | End point analysis scan failure |
| Citrix Gateway | Excessive authentication failures |
| Citrix Gateway | Logon from suspicious IP |
| Citrix Gateway | Unusual authentication failure |
| Citrix Virtual Apps and Desktops | Suspicious Logon |
| Microsoft Graph Security | Azure AD Identity Protection risk indicators |
| Microsoft Graph Security | Microsoft Defender for Endpoint risk indicators |
Compromised endpoints
This category groups risk indicators that are triggered when devices exhibit unsecure behavior that might indicate a compromise.
The Compromised endpoints risk category groups the following risk indicators together:
| Data Sources | User Risk Indicators |
|---|---|
| Citrix Endpoint Management | Unmanaged device detected |
| Citrix Endpoint Management | Jailbroken or rooted device detected |
| Citrix Endpoint Management | Device with blacklisted apps detected |