
Monitor
From theMonitordashboard, you can view desktop usage, sessions, and machines in your Citrix DaaS Standard for Azure (formerly Citrix Virtual Apps and Desktops Standard for Azure) deployment. You can also control sessions, power-manage machines, end running applications, and end running processes.
To access theMonitordashboard:
- Sign in toCitrix Cloud, if you haven’t already. In the upper left menu, selectMy Services > DaaS Standard for Azure.
- From theManagedashboard, click theMonitortab.
Monitor desktop usage
Displays on this page refresh every five minutes.
Machine and Sessions Overview:You can tailor the display to show information about all catalogs (default) or a selected catalog. You can also tailor the time period: the last day, week, or month.
Counts at the top of the display indicate the total number of machines, plus the number of machines that are powered-on and powered-off. Hover over a value to display how many are single-session and multi-session.
The graph below the counts shows the number of powered-on machines and peak concurrent sessions at regular points during the time period you selected. Hover on a point the graph to display the counts at that point.

Top 10s:To tailor a top 10 display, select a time period: the past week (default), month, or three months. You can also tailor the display to show only information about activity involving single-session machines, multi-session machines, or applications.
- Top 10 Active Users:Lists the users who started desktops most frequently during the time period. Hovering on a line displays the total launches.
- Top 10 Active Catalogs:Lists the catalogs with the longest duration during the selected time period. Duration is the sum of all user sessions from that catalog.

Desktop usage report
To download a report containing information about machine launches during the last month, clickLaunch Activity. A message indicates that the request is being processed. The report downloads automatically to the default download location on the local machine.
Filter and search to monitor machines and sessions
When you’re monitoring session and machine information, all machines or sessions are displayed by default. You can:
- Filter the display by machines, sessions, connections, or applications.
- Refine the display of sessions or machines by choosing the criteria you want, building a filter by using expressions.
- Save the filters that you build, for reuse.
Control a user’s applications
You can display and manage applications and processes for a user that has a running session or an assigned desktop.
- From theMonitordashboard, clickSearchand enter the user name (or the beginning characters of the user name), machine, or endpoint. From the search results, select the item you’re looking for. (To collapse the search box without searching, clickSearchagain.)
Select a session.
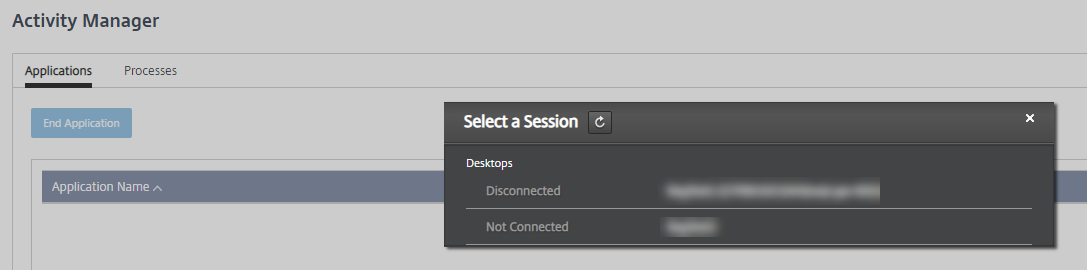
The Activity Manager lists the applications and processes for the user’s session.
To end an application, on theApplicationstab in Activity Manager, click in the application’s row to select that application, and then clickEnd Application.

- To end a process, on theProcessestab in Activity Manager, click in the process’s row to select that process, and then clickEnd Process.
- To display session details, clickDetails在右上角。返回到应用程序and processes display, click Activity Manager in the upper right.
- To control the session, clickSession Control > Log OfforSession Control > Disconnect.


Shadow users
Use the shadow feature to view or work directly on a user’s virtual machine or session. You can shadow Windows and Linux VDAs. The user must be connected to the machine that you want to shadow. Verify this by checking the machine name listed in theUsertitle bar.
Shadowing launches in a new browser tab. Ensure that your browser allows pop-ups from the Citrix Cloud URL.
In a Citrix Managed Azure subscription, shadowing is supported only for users on domain-joined machines. To shadow a non-domain-joined machine in a Citrix Managed Azure subscription, you must set up a bastion machine. For details, seeBastion access.
Shadowing must be initiated from a machine on the same virtual network as the domain-joined machines, and also meet any port requirements.
Enable shadowing
- From theMonitordashboard, go to theUser Detailsview.
- Select the user session, and then clickShadowin theActivity Managerview or theSession Detailspanel.
Shadow Linux VDAs
Shadowing is available for Linux VDAs Version 7.16 or and later running the RHEL7.3 or Ubuntu Version 16.04 Linux distributions.
Monitor uses the FQDN to connect to the target Linux VDA. Ensure that the Monitor client can resolve the FQDN of the Linux VDA.
- The VDA must have the
python-websockifyandx11vnc packages installed. noVNCconnection to the VDA uses the WebSocket protocol. By default,ws://WebSocket protocol is used. For security reasons, Citrix recommends that you use the securewss://protocol. Install SSL certificates on each Monitor client and Linux VDA.
Follow the instructions in Session Shadowing to configure your Linux VDA for shadowing.
- After you enable shadowing, the shadowing connection initializes and a confirmation prompt appears on the user device.
- Instruct the user to clickYesto start the machine or session sharing.
- The administrator can view only the shadowed session.
Shadow Windows VDAs
Windows VDA sessions are shadowed using Windows Remote Assistance. Enable theUse Windows Remote Assistancefeature when installing the VDA.
- After you enable shadowing, the shadowing connection initializes and a dialog box prompts you to open or save the
.msrc incidentfile. - Open the incident file with the Remote Assistance Viewer, if it’s not already selected by default. A confirmation prompt appears on the user device.
- Instruct the user to clickYesto start the machine or session sharing.
- For more control, ask the user to share keyboard and mouse control.
Monitor and control sessions
Session displays are updated every minute.
In addition to viewing sessions, you can disconnect one or more sessions or log off users from sessions.
From theMonitordashboard, clickFilters.

Select theSessionsview.

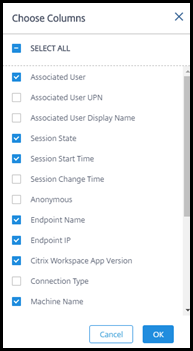
To tailor the display, clickChoose Columnsand select the check boxes of items you want to appear. When you’re done, clickOK. The sessions display refreshes automatically.
- Click the check box to the left of each session you want to control.
- To log off or disconnect the session, elect eitherSession Control > Log OfforSession Control > Disconnect.


Remember that the power management schedule for the catalog can also control disconnecting sessions and logging off users from disconnected sessions.
As an alternative to the above procedure you can alsoSearchfor a user, select the session you want to control, and then display session details. The log off and disconnect options are available there, too.
Session information report
To download session information, clickExporton the sessions display. A message indicates that the request is being processed. The report downloads automatically to the default download location on the local machine.
Monitor and power control machines
Machine displays are updated every minute.
- From theMonitordashboard, clickFilters.
Select theMachinesview.

By default, the display lists single-session OS machines. Alternatively, you can display multi-session machines.
To tailor the display, clickChoose Columnsand select the check boxes of items you want to appear. When you’re done, clickOK. The machines display refreshes automatically.

- To power-control machines or place them in or out of maintenance mode, click the check box to the left of each machine you want to control.
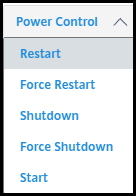
To power-control the selected machines, clickPower Controland select an action.
- To place the selected machines in or out of maintenance mode, clickMaintenance Mode > ONorMaintenance Mode > OFF.


When you use the search feature to find and select a machine, you see machine details, utilization, historical utilization (from the last seven days), and average IOPS.
Machine information report
To download session information, clickExporton the machines display. A message indicates that the request is being processed. The report downloads automatically to the default download location on the local machine.
检查应用程序和桌面卫生
Probing automates the process of checking the health of published apps and desktops. The health check results are available through theMonitordashboard. For details, see: