Dashboard
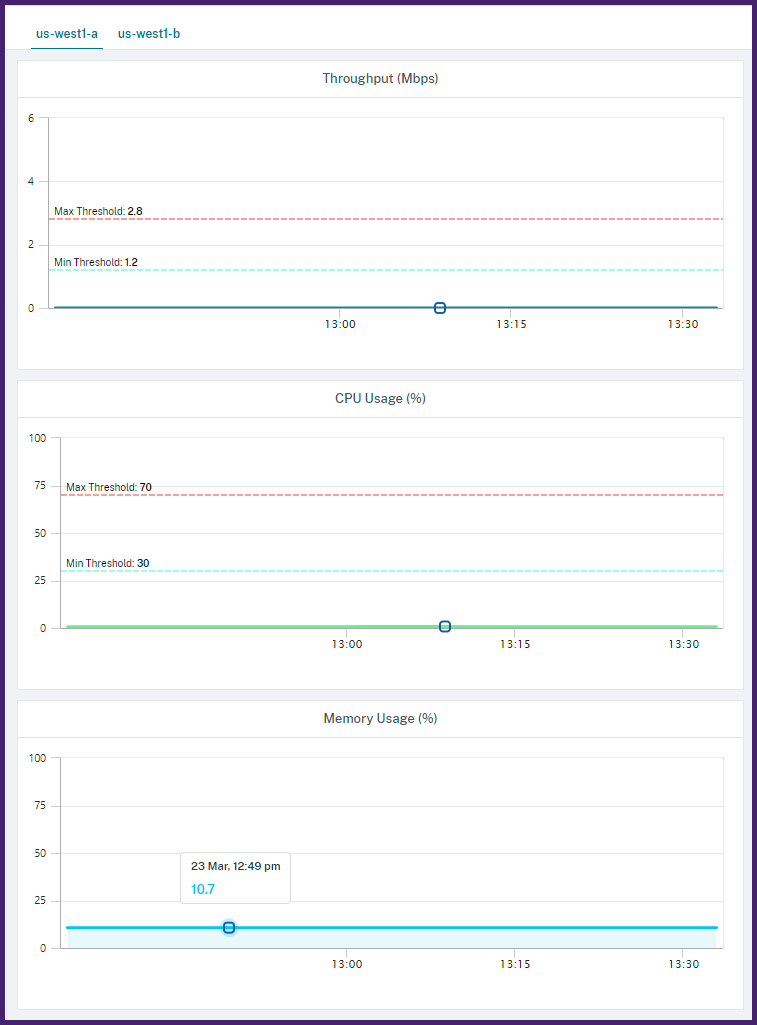
You can view the graph for the selected monitoring parameters. The right-side panel displays the events that trigger the autoscaling. The left-side panel displays the active nodes in the cluster per zone, the active nodes graph, and the events.
- In Citrix ADM, navigate toInfrastructure > Public Cloud > Autoscale Groups.
- Select the Autoscale group and clickDashboard.
下图迪splays a sample dashboard:
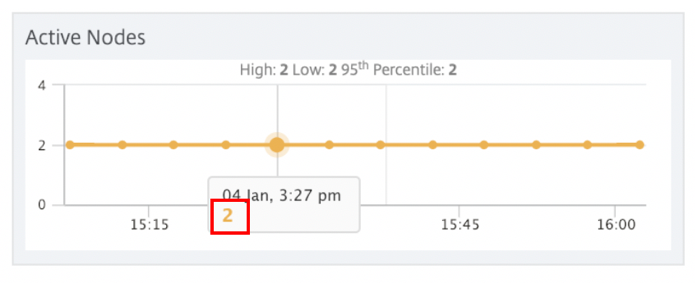
下图迪splays the active nodes graph. The number below the time stamp shows the number of active nodes. You can view the number of active nodes that are part of the zone at any given time.
Events
InDashboard,Eventstab displays the total number of events for the selected Autoscale group. It also displays a brief message of the latest event.
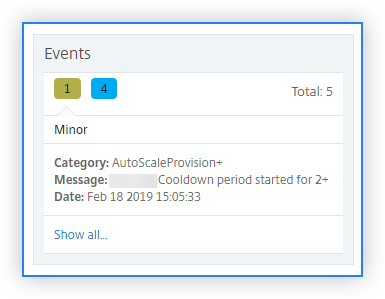
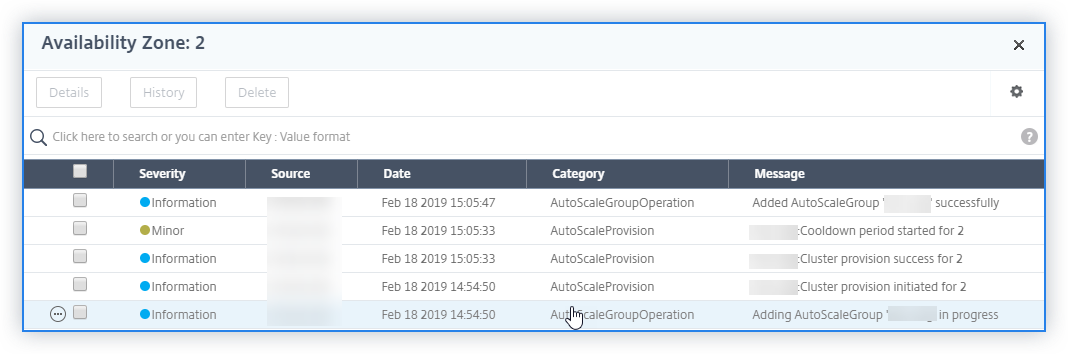
To see the details of the events, clickShow all.
The official version of this content is in English. Some of the Citrix documentation content is machine translated for your convenience only. Citrix has no control over machine-translated content, which may contain errors, inaccuracies or unsuitable language. No warranty of any kind, either expressed or implied, is made as to the accuracy, reliability, suitability, or correctness of any translations made from the English original into any other language, or that your Citrix product or service conforms to any machine translated content, and any warranty provided under the applicable end user license agreement or terms of service, or any other agreement with Citrix, that the product or service conforms with any documentation shall not apply to the extent that such documentation has been machine translated. Citrix will not be held responsible for any damage or issues that may arise from using machine-translated content.
DIESER DIENST KANN ÜBERSETZUNGEN ENTHALTEN, DIE VON GOOGLE BEREITGESTELLT WERDEN. GOOGLE LEHNT JEDE AUSDRÜCKLICHE ODER STILLSCHWEIGENDE GEWÄHRLEISTUNG IN BEZUG AUF DIE ÜBERSETZUNGEN AB, EINSCHLIESSLICH JEGLICHER GEWÄHRLEISTUNG DER GENAUIGKEIT, ZUVERLÄSSIGKEIT UND JEGLICHER STILLSCHWEIGENDEN GEWÄHRLEISTUNG DER MARKTGÄNGIGKEIT, DER EIGNUNG FÜR EINEN BESTIMMTEN ZWECK UND DER NICHTVERLETZUNG VON RECHTEN DRITTER.
CE SERVICE PEUT CONTENIR DES TRADUCTIONS FOURNIES PAR GOOGLE. GOOGLE EXCLUT TOUTE GARANTIE RELATIVE AUX TRADUCTIONS, EXPRESSE OU IMPLICITE, Y COMPRIS TOUTE GARANTIE D'EXACTITUDE, DE FIABILITÉ ET TOUTE GARANTIE IMPLICITE DE QUALITÉ MARCHANDE, D'ADÉQUATION À UN USAGE PARTICULIER ET D'ABSENCE DE CONTREFAÇON.
ESTE SERVICIO PUEDE CONTENER TRADUCCIONES CON TECNOLOGÍA DE GOOGLE. GOOGLE RENUNCIA A TODAS LAS GARANTÍAS RELACIONADAS CON LAS TRADUCCIONES, TANTO IMPLÍCITAS COMO EXPLÍCITAS, INCLUIDAS LAS GARANTÍAS DE EXACTITUD, FIABILIDAD Y OTRAS GARANTÍAS IMPLÍCITAS DE COMERCIABILIDAD, IDONEIDAD PARA UN FIN EN PARTICULAR Y AUSENCIA DE INFRACCIÓN DE DERECHOS.
本服务可能包含由 Google 提供技术支持的翻译。Google 对这些翻译内容不做任何明示或暗示的保证,包括对准确性、可靠性的任何保证以及对适销性、特定用途的适用性和非侵权性的任何暗示保证。
このサービスには、Google が提供する翻訳が含まれている可能性があります。Google は翻訳について、明示的か黙示的かを問わず、精度と信頼性に関するあらゆる保証、および商品性、特定目的への適合性、第三者の権利を侵害しないことに関するあらゆる黙示的保証を含め、一切保証しません。
ESTE SERVIÇO PODE CONTER TRADUÇÕES FORNECIDAS PELO GOOGLE. O GOOGLE SE EXIME DE TODAS AS GARANTIAS RELACIONADAS COM AS TRADUÇÕES, EXPRESSAS OU IMPLÍCITAS, INCLUINDO QUALQUER GARANTIA DE PRECISÃO, CONFIABILIDADE E QUALQUER GARANTIA IMPLÍCITA DE COMERCIALIZAÇÃO, ADEQUAÇÃO A UM PROPÓSITO ESPECÍFICO E NÃO INFRAÇÃO.


