
View applications
By default, the application dashboard displays all applications. Depending upon your requirement, you can use the filter option to view applications.
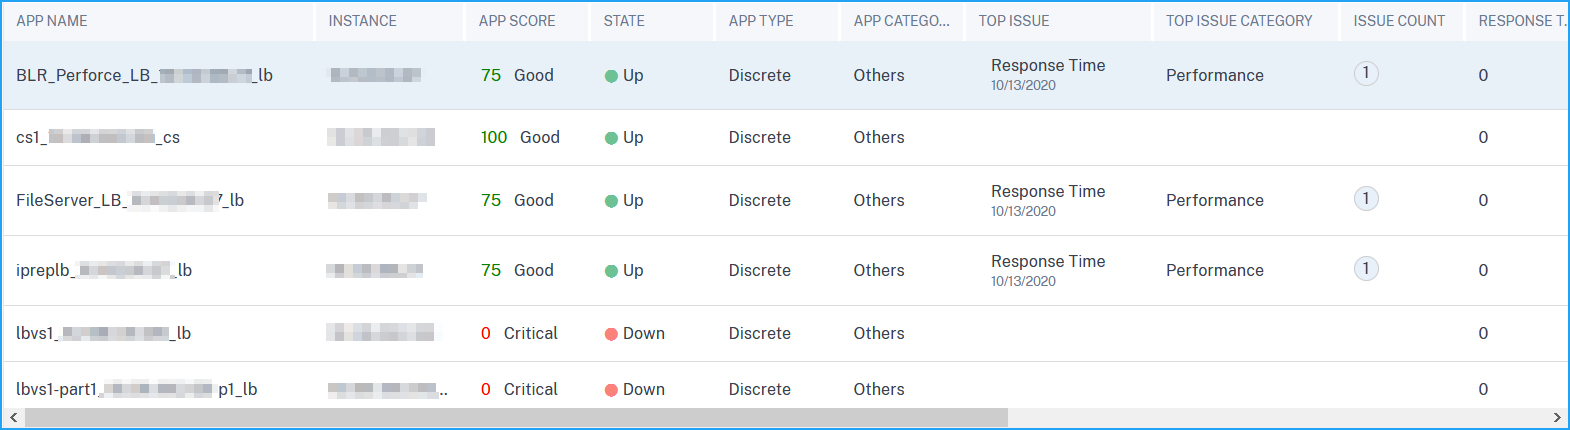
The dashboard displays the following application details:
App name– Denotes the application name.
Instance– Denotes the NetScaler instance.
App Score– Denotes the application score and the status such asCritical,Good,Fair, andNot Applicable.
State– Denotes the current availability of the application, such asUp,Down,Partially Up,Out of Service, andNA.
Up– All virtual servers associated with the application are Up.
Down– All virtual servers associated with the application are Down.
Partially Up– Either one virtual associated with the application is Down or Out of Service.
Out of Service– All virtual servers associated with the applications are out of service.
NA– No virtual servers is configured for the application.
App Type– Denotes the application type such asCustom,Discrete, orKubernetes services.
App Category– Denotes the category that is assigned to the application.
Top issue– Denotes the issue that has the maximum error counts on the application.
Top issue category– Denotes the category of the issue.
Issue count– Denotes the total issue counts for the application.
Response time– Denotes the average response time to respond from the application.
Total requests– Denotes the total requests received by the application.
Throughput– Denotes the total network throughput for the application. Throughput is calculated by the Req Bytes / Sec + Res Bytes / Sec for the virtual servers.
Data volume– Denotes the total data processed by the application.
Client connections– Denotes the average client connections established by the application.
Server connections——表示服务器connecti平均ons established by the application.
View microservices applications
To view the microservices applications, select theK8s_Discreteoption underApp Typefilter.
You can view the microservice applications inApp Dashboardas the following name format:
For example,tea-beverage_sg-demo_adm-clusterrefers to a service named “tea-beverage” with the namespace ofsg-demoin the clusteradm-cluster.
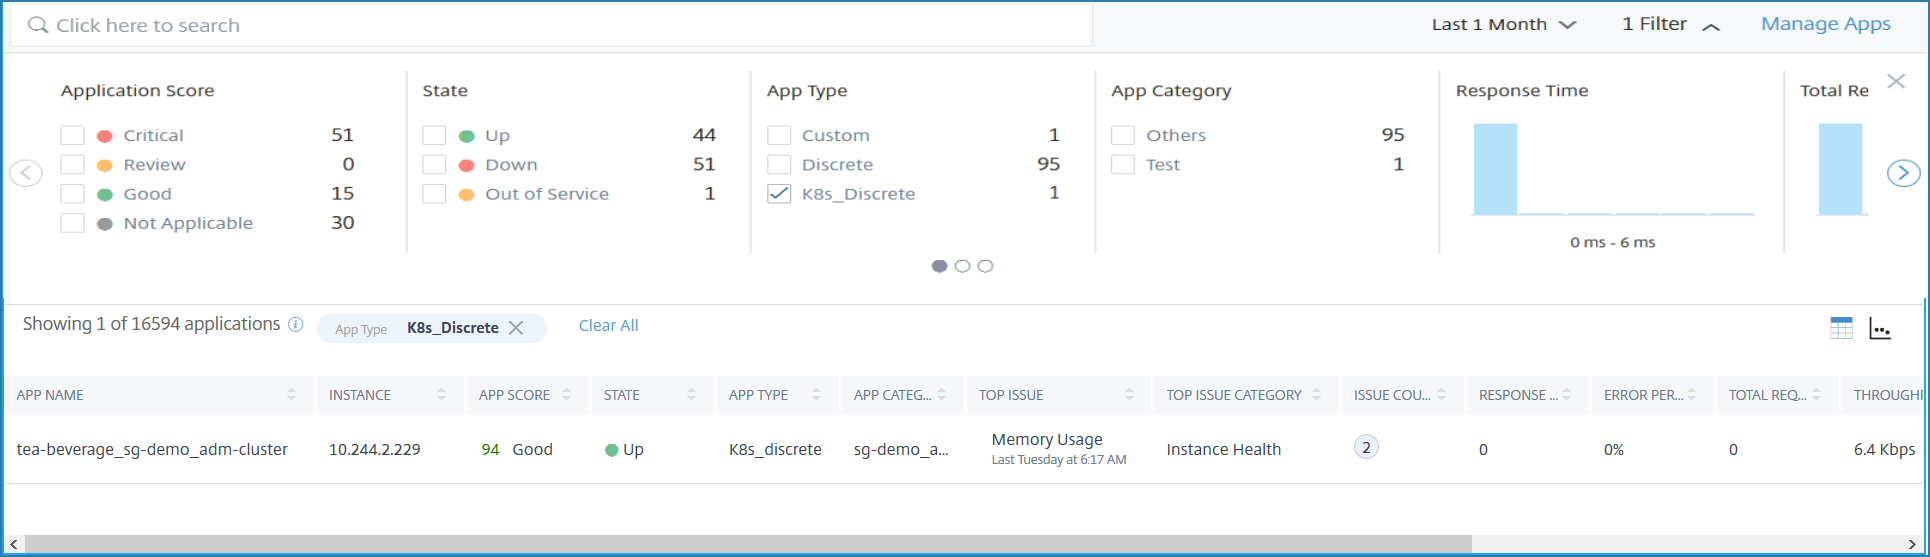
The following metrics are displayed in dashboard for the selected time duration:
App Name– Denotes the application name.
Instance– Denotes the NetScaler CPX instance IP address.
App Score– Denotes the application score.
Critical– App score is between 0 and < 40
Review– App score is between 40 and < 75
Good– App score is greater than 75
State– Denotes the current application status.
App Category– Denotes the cluster name where the application is hosted.
Top Issue– Denotes the top issues that affects the current application score.
Top Issue Category– Denotes the issue category affecting the application.
Issue Count– Denotes the total issues affecting the application. Hover the mouse pointer on the issue count to see the overview of the issues.
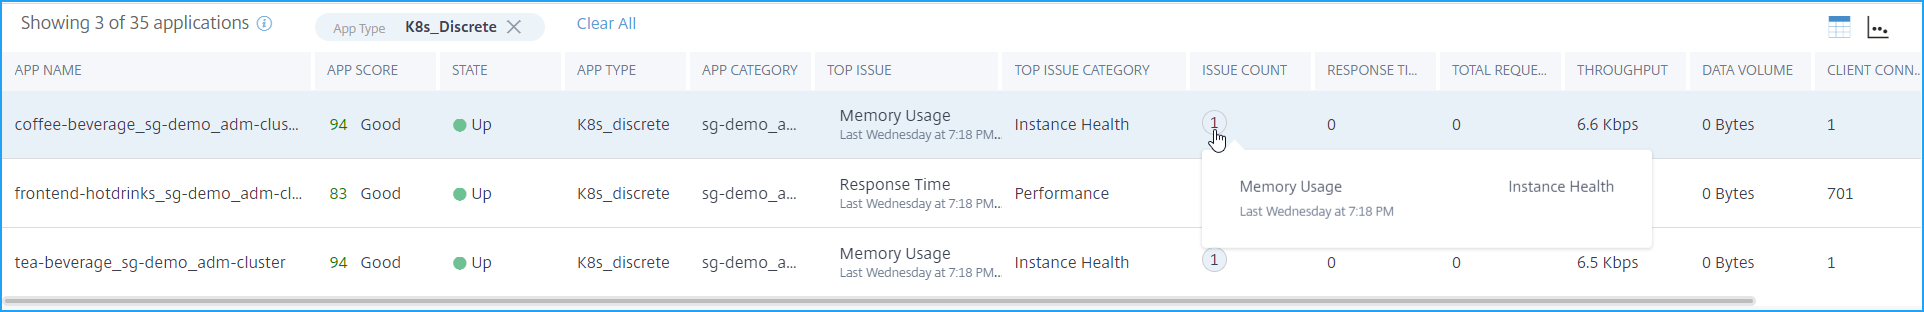
Response Time– Denotes the average response time received by the application.
Error Percentage– Denotes the average error percentage of 5xx errors for the application.
Total Requests– Denotes the total number of requests received by the application.
Throughput——表示总网络吞吐量processed by the application.
Data volume– Denotes the total data processed by the application. Data volume is calculated as the total request bytes and response bytes for the application.
Client connections– Denotes the average client connections established by the application. This can also refer to the associated outgoing services connected with the selected service.
Server connections——表示服务器connecti平均ons established by the application. This can also refer to the associated incoming services connected with the selected service.
Click the+option to add or remove the options to be displayed in the dashboard.
Click an application to view the application details. For more information,Microservices application details