Application details
Click an application from the dashboard to drill down for further detailed information.
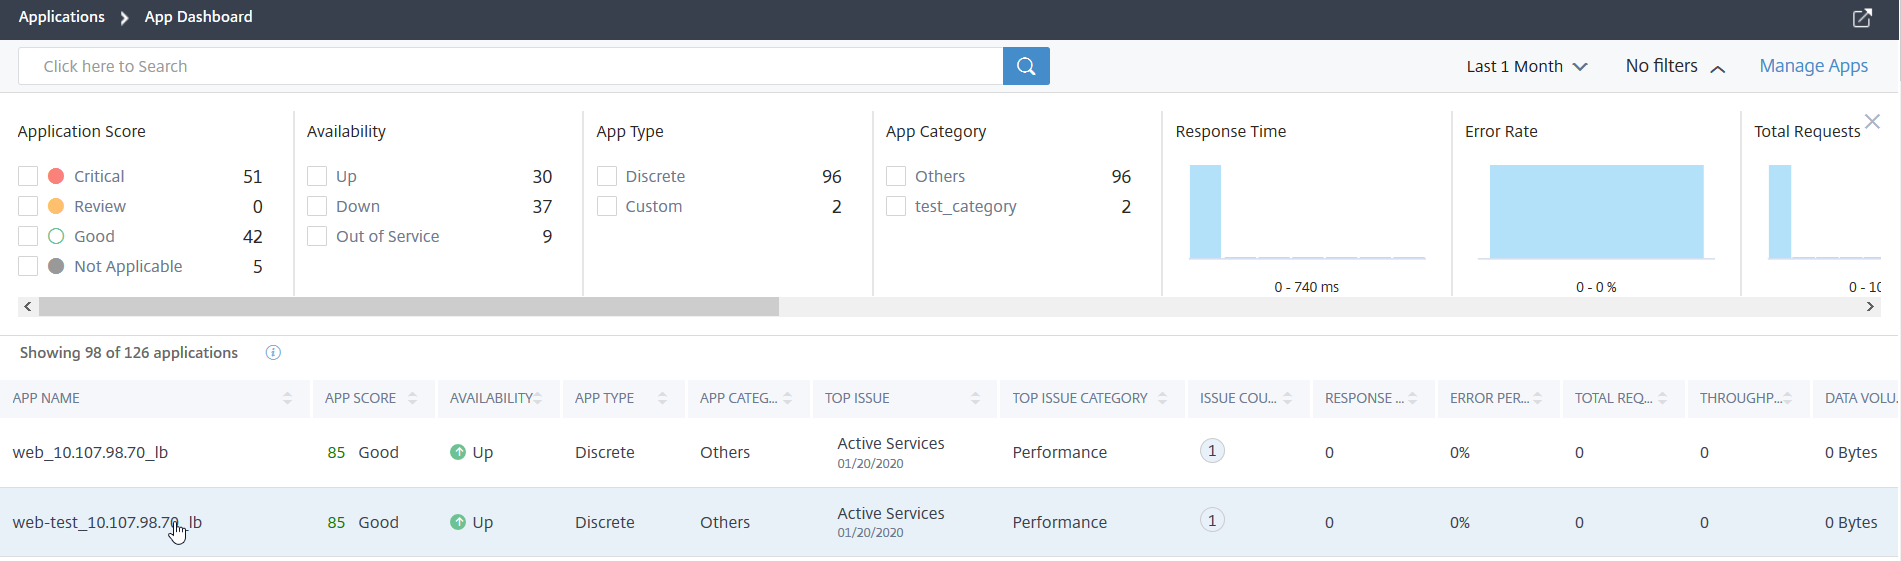
The selected application page is displayed.

From the application details page:
Select the time duration from the list to view details for the specific time duration
ClickService Graphto view service graph for the selected application. For more information, seeService Graph for Applications
ClickTransaction Logsto view the detailed transactions for the selected application
ClickAudit logsto view the detailed audit log information
ClickConfigureto view or edit the service and service group configuration for the selected application
ClickServiceto view services that bound to the application
After you select the time duration, the following application details are displayed:
App Score– The application score for the selected time duration. The final score is calculated as100 minus total penalty.
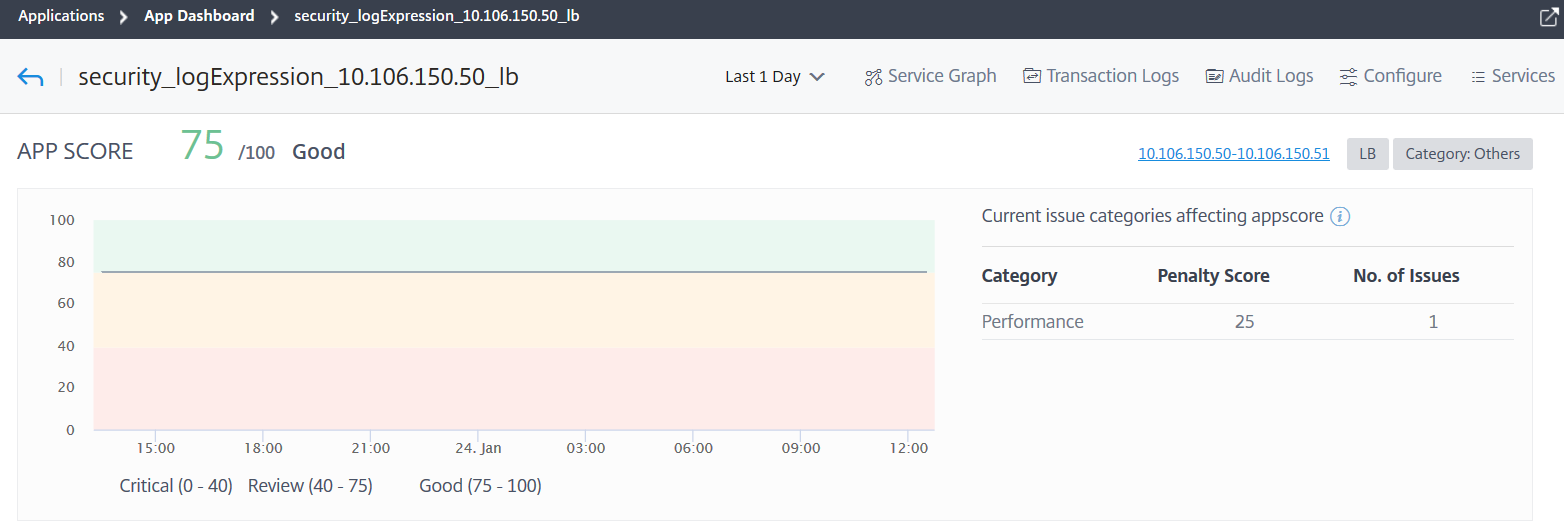
This dashboard also enables you to view the current issues that are affecting the app score. You can view the issues details under Issues.
Virtual Servers–
Note
TheVirtual Serverssection is displayed only for the custom applications. For discrete applications, click theIP addressto view the virtual server details.

Displays all virtual servers associated with the custom application
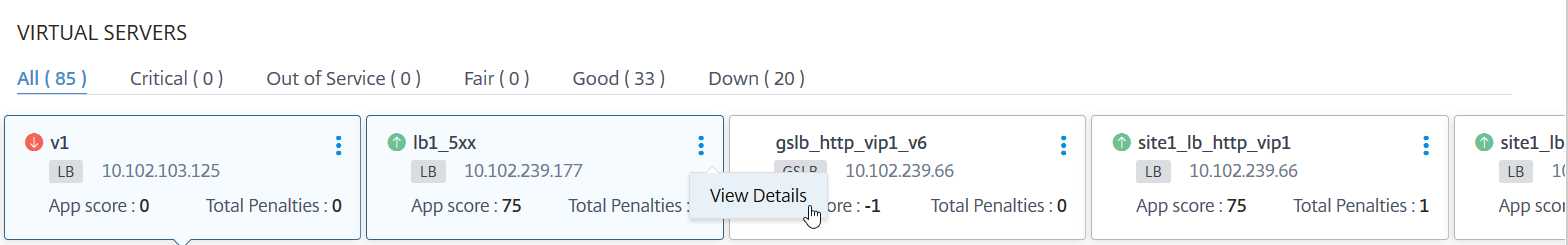
ClickView Detailsto view and manage the virtual server settings.
All Services– The services that are bound to the application
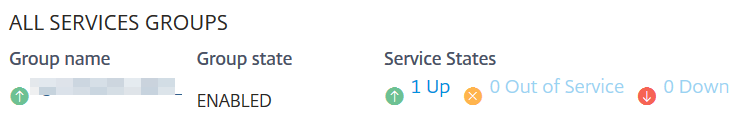
Click to view the service details and to manage the service settings
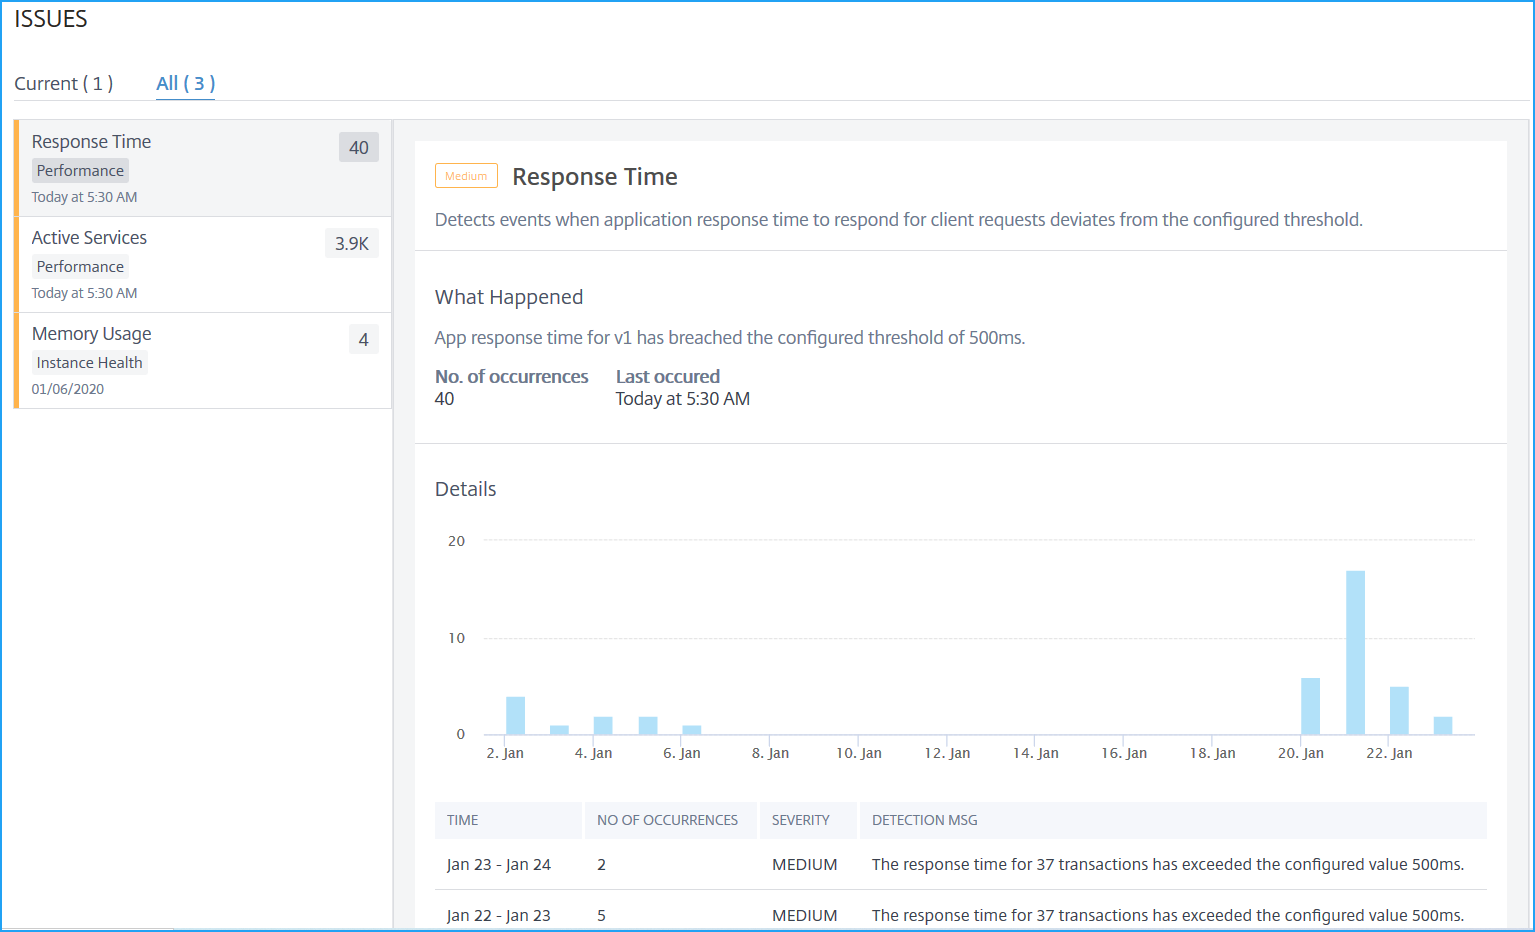
Issues– The issues that are applicable for selected application. You can view the following issues along with its category:
Performance Instance Health Config System Resources Response Time Average CPU Usage Unstable Server Improper persistence type Active Services Memory Usage Unusually large HTTP packets NIC Card Saturation Low Session Reuse TCP reassemble queue limit hits App CPU Usage SurgeQueue Buildup SSL Real Time Traffic Session buildup Server response time Service flaps Click each issue to check details such as detection message, when the issue has occurred, Recommended actions, and details.
For more information, seePerformance indicators for application analytics.
The following image is the earlier view ofApp Activity Investigatorpage:
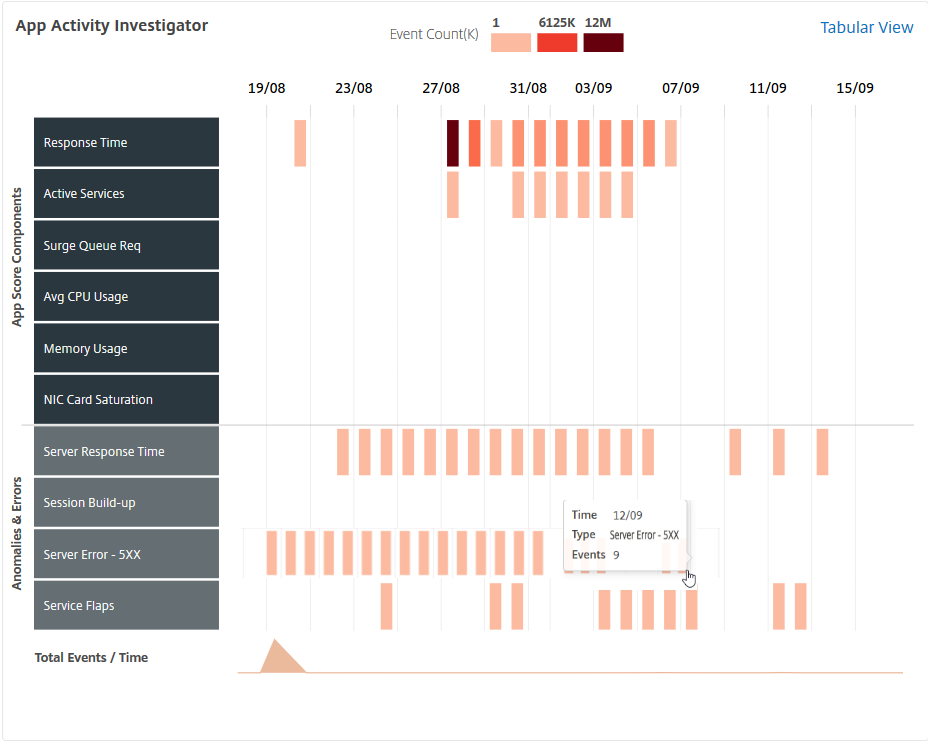
You can now view all issues in theIssuessection, along with the category that you were able to view inApp Activity Investigator页面。
The issues that display inCurrenttab refer to the application issues for the select time duration.
The issues that display inAlltab refer to total application issues.
The following example is the application issues for 1-day duration. TheCurrenttab indicates no current issues impacting the app score.
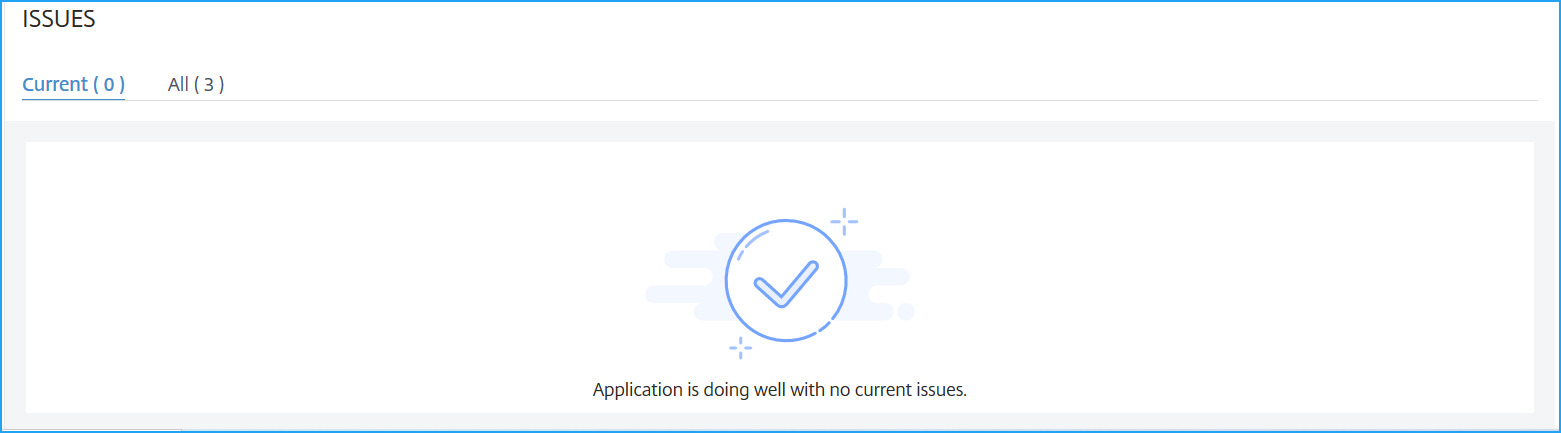
TheAlltab displays the total issues detected for the 1-day duration.

Check monitor status of an application
You can use the application dashboard in the NetScaler ADM GUI underApplications > Dashboard, to view the health monitor status of an application and the failure message if any. You can bind health monitors can be bound to service or service group of an application, and a service or service group can have multiple monitors bound to it. Monitors help you monitor your services.
要查看的状态监控,遵循这些teps.
From the NetScaler ADM GUI, navigate toApplications > Dashboard. UnderApplications, select the application whose health you want to check.
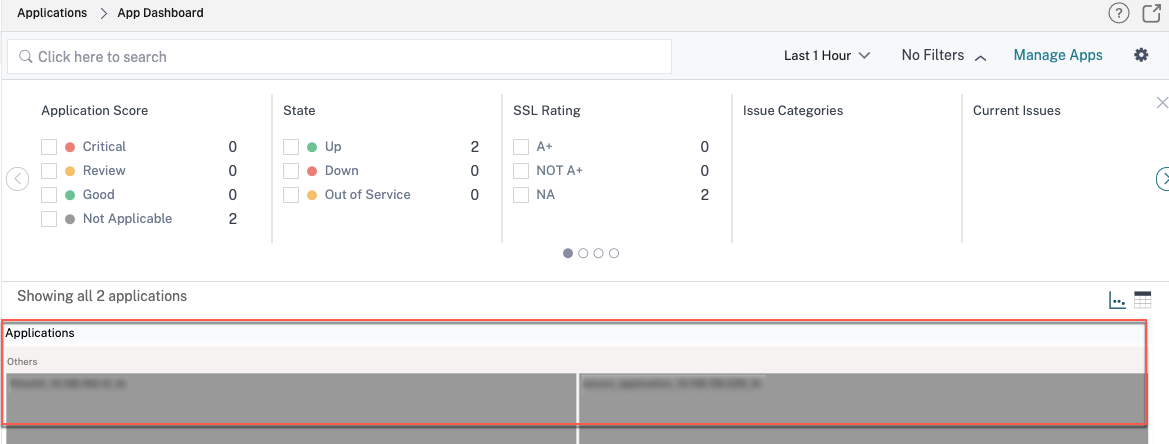
Click the application. The app score dashboard appears.

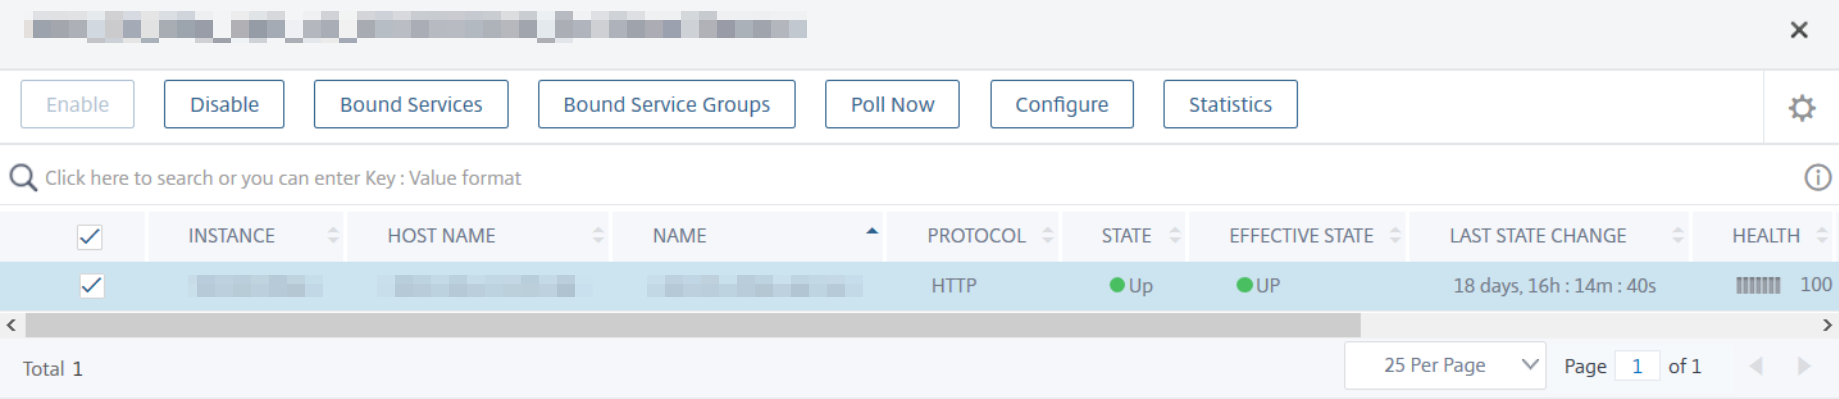
Click theServicestab on the upper-right corner or the service group underGroup Name.
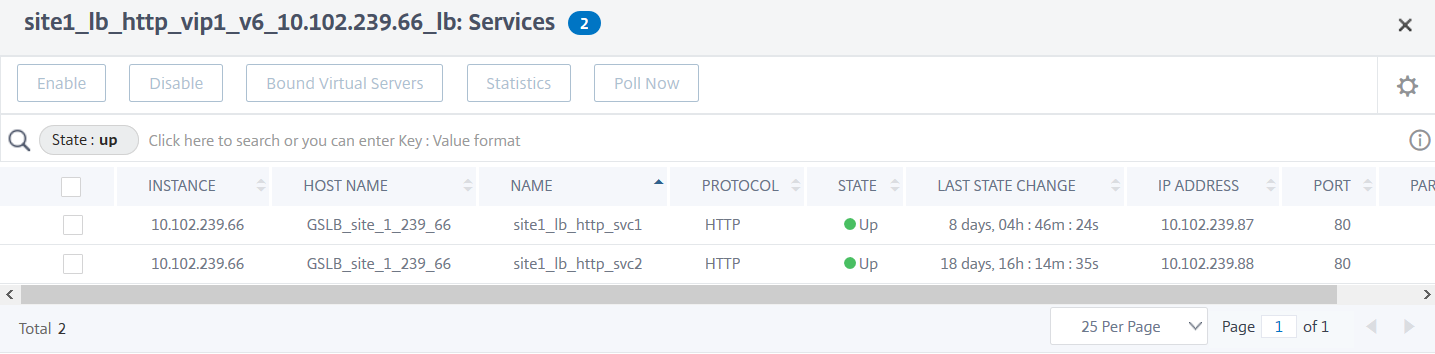
If you click theServicestab, in the next screen, select the service group.
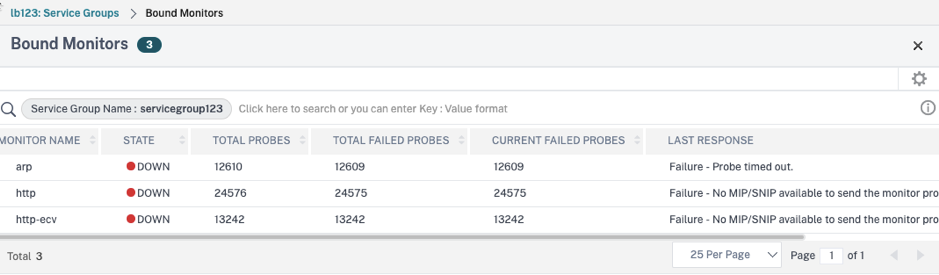
If you click the service group, theService Groups window appears. Select the instance and clickBound Monitors
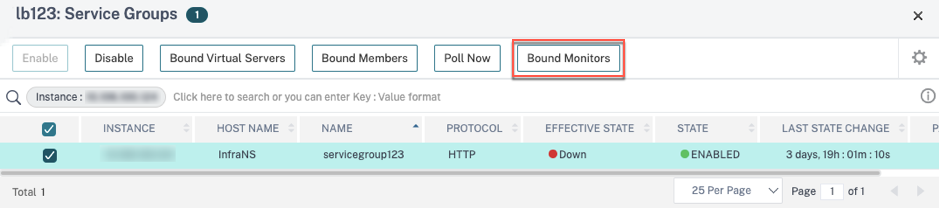
The bound monitor screen appears, showing the health monitor status of the application.